

2017 Year End Financial Benchmark Charts and Graphs
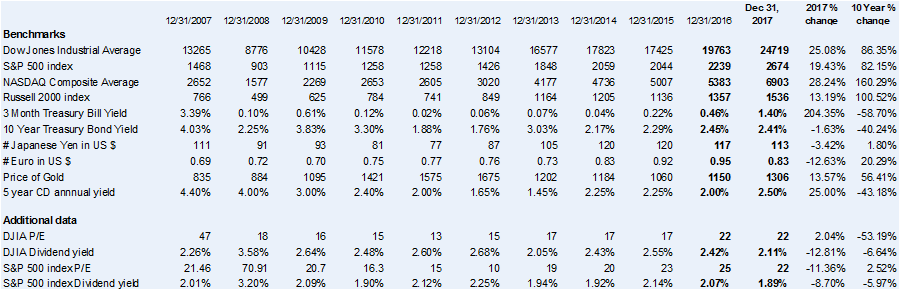
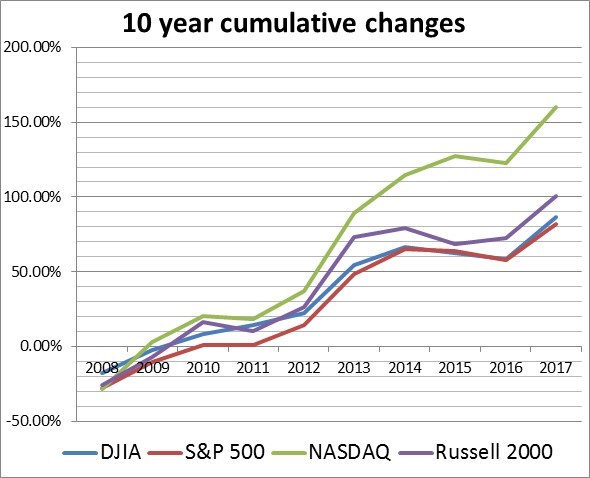
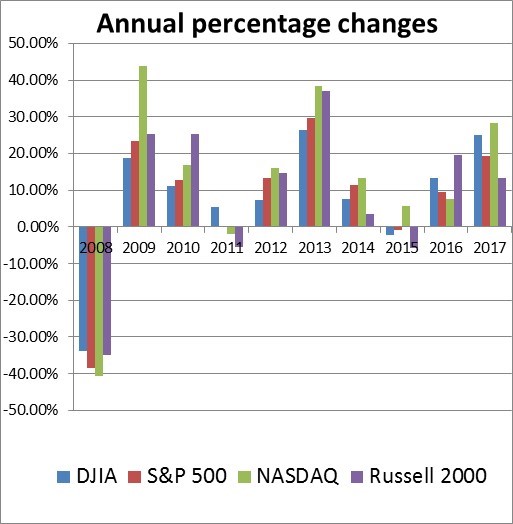
These charts continue an annual tradition I started ages ago to use when I do financial planning with clients. The charts show the 10-year annual and cumulative percentage gains or losses of the major stock market indexes, interest rates, currencies and gold. The indexes include the dividends paid. These charts are provided for illustrative and educational purposes. No recommendations are made or should be inferred from the information presented. Also note that past results are no indicator of future performance.
10 year financial benchmark performance of major stock market indexes,
interest rates, currencies and gold
How Can We Help?

